
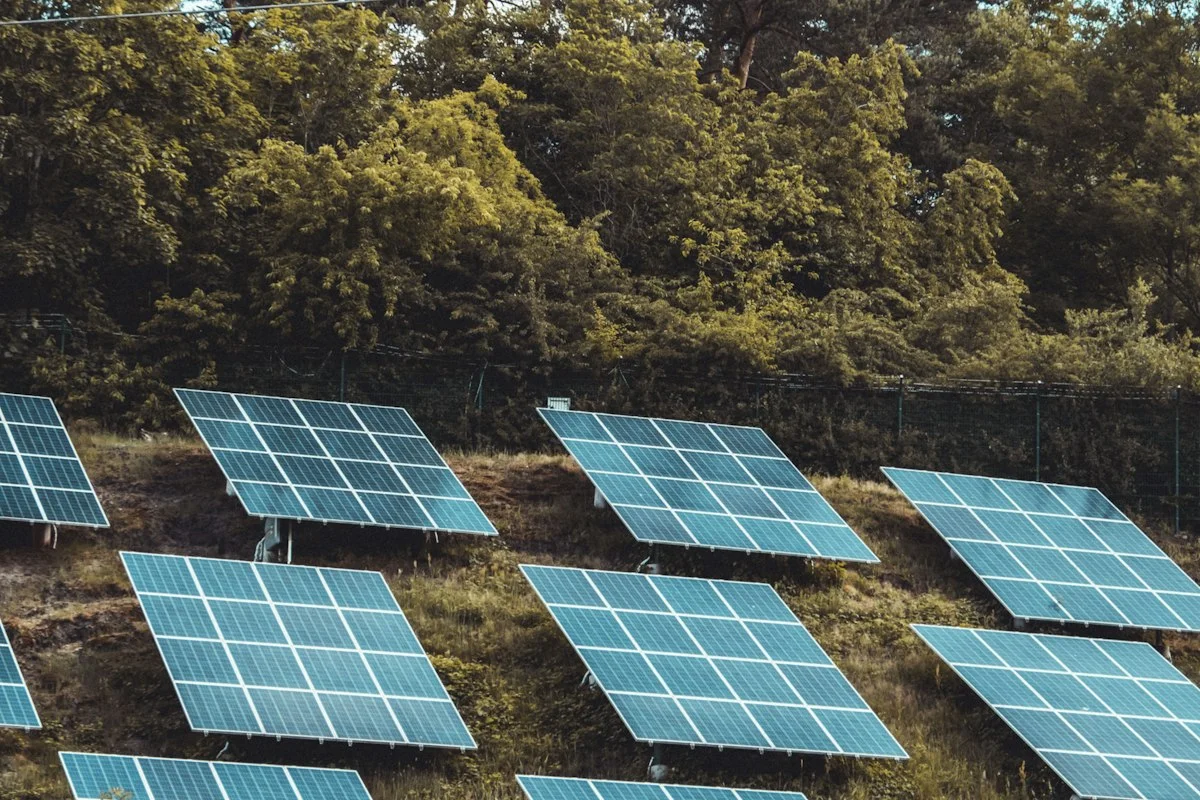
- The Clipping Fallacy: Solar array owners often panic when monitoring apps display a flat-topped generation curve between 11:30 AM and 1:30 PM on clear summer days. In reality, modern solar designs intentionally engineer an Inverter Loading Ratio (ILR) of 1.25 to 1.35 (DC-to-AC capacity).
- Shoulder Hour Energy Harvest: By oversizing the DC array, the inverter reaches its peak operating plateau earlier in the morning and sustains it later into the evening, generating significantly more total kilowatt-hours (kWh) across 365 days than a 1:1 paired system.
- Sub-2% Clipping Losses vs. Capital Expenditure: Upgrading to a larger inverter to capture the razor-thin summer peak increases equipment costs and raises the inverter’s minimum startup voltage, reducing low-light cloudy day performance. Total energy lost to clipping rarely exceeds 1% to 2% annually.
- Solar Systems Links: Review our solar panel degradation rates (TOPCon vs. HJT) and our microinverters vs. DC string optimizers guide.
When residential solar power systems are commissioned, homeowners frequently obsess over their mobile monitoring graphs. On crisp, cloudless June afternoons, many observe that power output rises sharply, hits a rigid horizontal ceiling for two hours, and then slopes downward.
This phenomenon—known as inverter clipping—frequently triggers angry calls to solar installation companies claiming that the inverter is undersized or defective. However, in professional photovoltaic engineering, clipping is not a design flaw; it is an intentional, mathematically optimized design strategy that maximizes financial return on investment.
What Is Solar Inverter Clipping?
Solar inverter clipping occurs when the DC electricity generated by solar panels exceeds the maximum continuous AC power rating of the inverter. The inverter automatically limits power input to its safety threshold, flattening the peak curve to protect internal electronics while maximizing overall daily energy yield.
To understand why engineers design systems to clip, we must examine the economics of Inverter Loading Ratios.
Inverter Loading Ratio (ILR) Performance Matrix
The following engineering matrix compares annual energy yield, clipping losses, and financial returns across different DC-to-AC sizing ratios:
| DC-to-AC Ratio (ILR) | Summer Midday Clipping | Morning / Evening Harvest | Cloudy Day Performance | Levelized Cost of Energy (LCOE) |
|---|---|---|---|---|
| 1.00 : 1 (1:1 Ratio) | 0.0% (Zero clipping) | Sub-optimal (slow morning ramp) | Poor (operates below peak efficiency) | Higher (oversized, expensive inverter) |
| 1.15 : 1 (Conservative) | < 0.5% annual loss | Moderate shoulder gain | Good low-light generation | Solid baseline return |
| 1.25 to 1.30 : 1 (Gold Standard) | 1.0% to 1.8% annual loss | Maximum shoulder energy gain | Excellent (inverter activates earlier) | Lowest LCOE ($/kWh generated) |
| 1.40+ : 1 (Aggressive) | 3.0% to 5.5% annual loss | Diminishing marginal returns | High low-light output | Higher thermal stress on inverter |
The Geometry of the Generation Curve: Wider Beats Taller
Solar energy production is calculated as the area under the power-versus-time curve (kWh = Power × Time). A 1:1 paired system produces a tall, narrow needle that touches 10kW for only 15 minutes at solar noon on the longest summer day. The rest of the year, that oversized 10kW inverter operates at 30% to 60% capacity, where power conversion efficiency drops.
By pairing a 10kW DC solar array with a 7.6kW AC inverter (an ILR of 1.31), the generation curve expands horizontally. The inverter reaches its 7.6kW maximum rating by 9:30 AM and maintains it until 3:30 PM. The additional energy harvested during those early morning and late afternoon hours vastly outweighs the tiny clipped triangle at noon.
Real-World Thermal and Panel Degradation Mitigation
Furthermore, solar panels are rated under Standard Test Conditions (STC: 25°C / 77°F cell temperature). In real-world summer conditions, dark solar cells heat up to 55°C–65°C. Due to silicon temperature coefficients (-0.30% to -0.38% per °C), actual panel output drops by 10% to 15% during the hottest midday hours, naturally reducing clipping.
Over a 25-year system lifespan, panels degrade at 0.3% to 0.5% annually. A slightly oversized DC array ensures that as panels age, your system continues delivering maximum AC output well into its second decade of operation.
Do not pay extra to upsize an inverter just to eliminate a flat top on your summer monitoring app. An Inverter Loading Ratio of 1.25 to 1.30 delivers the lowest levelized cost of energy, boosts valuable shoulder generation during peak utility time-of-use (TOU) pricing windows, and guarantees superior winter and cloudy-day performance.