
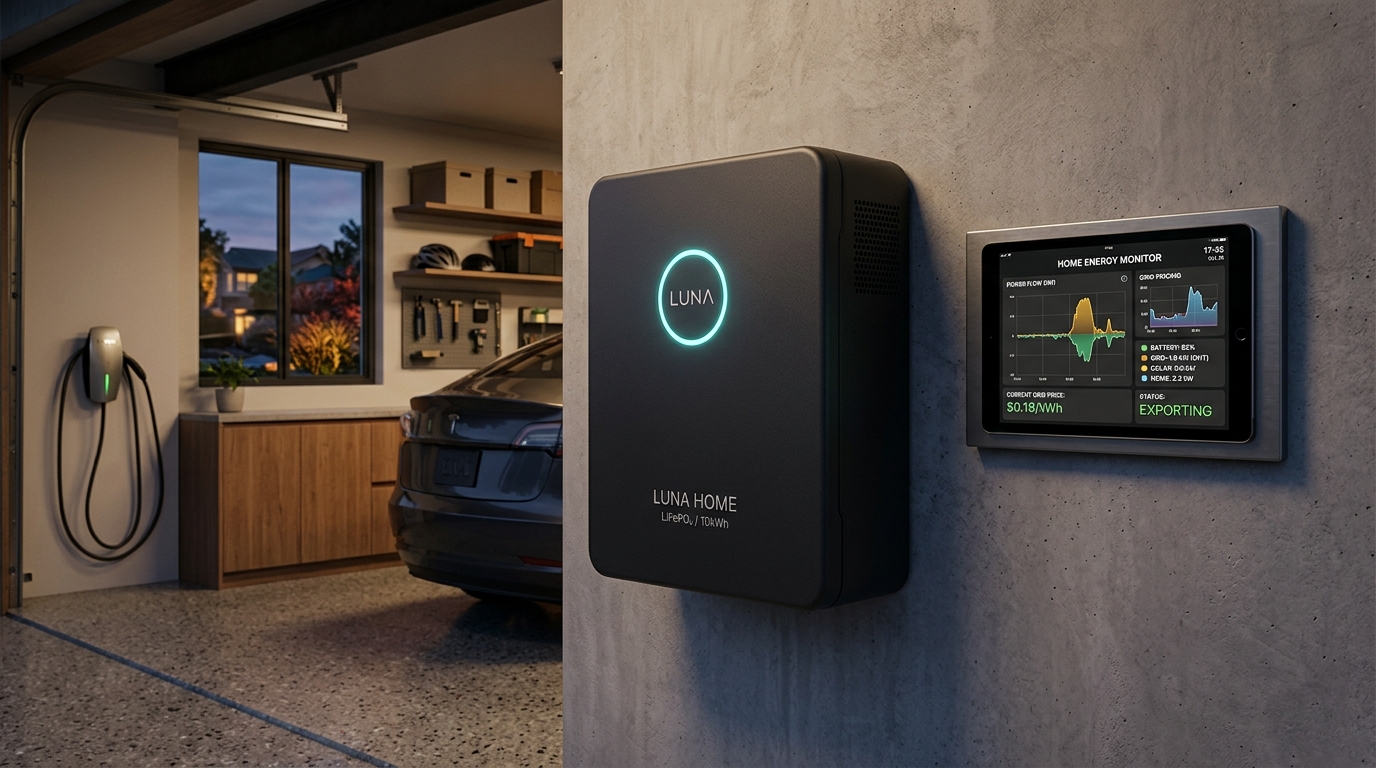
In the consumer clean energy space, residential battery storage systems are frequently sold under a compelling financial pitch: ‘Arbitrage the grid.’ The concept sounds deceptively simple: charge your home battery overnight during super-off-peak hours when wholesale power is cheap (or free from your rooftop solar), and discharge that stored energy during peak late-afternoon windows when utility rates skyrocket, banking the spread as pure financial savings.
Under regulatory shifts like California’s Net Billing Tariff (NEM 3.0), Ontario’s Ultra-Low Overnight (ULO) rate structure, and dynamic nodal pricing across ERCOT in Texas, TOU arbitrage has become the primary financial justification for adding $10,000 to $18,000 in battery hardware to a home. Yet, in 2026, empirical forensic telemetry reveals that the vast majority of online ‘battery payback calculators’ are fundamentally dishonest. By failing to account for conversion losses, auxiliary parasitic thermal loads, and cell degradation costs per cycled kilowatt-hour, they paint a wildly optimistic picture of an investment that often struggles to reach positive Levelized Cost of Storage (LCOS) parity.
- The Real-World Round-Trip Efficiency (RTE) Tax: While manufacturers advertise battery cell DC efficiencies of 95%, real-world AC-to-AC round-trip efficiency—incorporating inverter DC-AC conversions, BMS parasitic standby power, and thermal management liquid cooling pumps—averages just 82% to 86%. For every 10 kWh stored, only 8.2 to 8.6 kWh are returned to the home.
- Cell Degradation Amortization: Lithium Iron Phosphate (LFP) cells degrade with every charge-discharge cycle. Factoring an installed system cost of $1,000 per usable kWh over a 6,000-cycle warranty life yields an inherent cell degradation cost of approximately $0.14 to $0.17 per cycled kWh that must be added to off-peak charging costs.
- The Minimum Spread Threshold: For daily TOU arbitrage to be mathematically profitable, the price delta between peak and off-peak utility tariffs must exceed at least $0.24 to $0.28 per kWh. Operating on narrow spreads ($0.12–$0.18/kWh) actually destroys capital over time.
- NEM 3.0 Avoided Cost Value: In markets with slashed net metering export credits, the primary financial value of a battery is not grid arbitrage, but 100% solar self-consumption, preventing daytime solar from being exported for pennies and offsetting expensive evening retail grid consumption.
The True Physics of Energy Arbitrage: Factoring Conversion Losses
When modeling battery arbitrage, one must track the complete physical journey of an electron from generation to consumption:
- Stage 1 (AC to DC Inversion): Grid AC power is rectified to high-voltage DC to enter the battery chemistry (approx. 96.5% efficiency).
- Stage 2 (Electrochemical Storage & Parasitic Draw): Chemical conversion losses, cell internal resistance, and continuous 24/7 power draw for the Battery Management System (BMS), sensors, and thermal management pumps consume 30W to 60W continuously (approx. 94% efficiency over 8 hours).
- Stage 3 (DC to AC Inversion): Battery DC power is inverted back to 240V split-phase AC to feed household breakers (approx. 96.5% efficiency).
The resulting cumulative AC-to-AC Round-Trip Efficiency is:
In cold garages or hot attics where active battery heating or cooling operates, real-world RTE frequently drops to 80% to 82%. This means you must buy 1.22 kWh of off-peak electricity to deliver 1.0 kWh during peak periods.
Forensic Financial Matrix: The 4 Common TOU Tariff Scenarios
The following financial model audits the daily profitability, cycle degradation, and real payback horizon across four real-world utility tariff environments for a standard 13.5 kWh usable LFP residential battery system:
| Utility Tariff Market | Off-Peak Rate | Peak Rate | Effective Rate Spread | Net Daily Profit (Post-Losses) | 10-Year Arbitrage Payback |
|---|---|---|---|---|---|
| California NEM 3.0 (PG&E E-ELEC) | $0.28 / kWh | $0.68 / kWh | $0.40 / kWh spread | +$3.85 / day ($1,405/yr) | 7.8 Years (Viable) |
| Ontario Ultra-Low Overnight (ULO) | $0.028 / kWh | $0.286 / kWh | $0.258 / kWh spread | +$2.45 / day ($894/yr) | 12.5 Years (Marginal) |
| Standard US Time-of-Use (Midwest) | $0.11 / kWh | $0.23 / kWh | $0.12 / kWh spread | +$0.18 / day ($65/yr) | Never (Cell Dies Before Payback) |
| Texas Dynamic Real-Time (ERCOT) | $0.04 / kWh avg | $1.20+ (Scarcity peaks) | Volatile Spikes | +$600/yr (Summer spike capture) | 9.5 Years (High Volatility) |
The True Value Stack: How to Actually Justify a Home Battery
If daily TOU arbitrage on moderate spreads fails to deliver rapid payback, why do informed homeowners continue installing battery systems? The answer lies in the full multi-tier value stack:
- Solar Self-Consumption (The NEM 3.0 Shield): Under modern utility rules, selling excess solar energy back to the grid yields wholesale credits of only $0.03 to $0.06/kWh, while buying power in the evening costs $0.35 to $0.60/kWh. Using an on-site battery to absorb 100% of daytime solar generation to power evening heat pumps and appliances captures the full retail spread without cycling grid power.
- Demand Charge & Service Upgrade Avoidance: In homes electrifying with multiple heat pumps, induction cooking, and Level 2 EV charging, peak coincident demand can easily exceed 100A or 200A. A battery with smart load-shaving capabilities can supply peak surge power, completely avoiding a $4,000 to $9,000 utility service and transformer upgrade.
- Insurance Against Extended Blackouts: Traditional whole-home standby generators cost $8,000 to $12,000 installed and consume expensive natural gas or propane while sitting idle 99% of the year. A battery provides silent, instantaneous blackout resilience while actively generating daily utility bill savings.
Do not buy a home battery based solely on the promise of Time-of-Use grid arbitrage unless your utility enforces an extreme peak-to-off-peak spread exceeding $0.25 per kilowatt-hour. Once you account for 85% round-trip conversion losses, thermal management parasitics, and the real cost of battery cell degradation, small tariff differentials evaporate into negligible daily gains. The true financial genius of residential storage in 2026 is pairing batteries with rooftop solar under avoided-cost export regimes, dodging expensive 200A panel service upgrades through peak shaving, and securing seamless blackout resilience. Treat arbitrage as a secondary operational bonus, not the foundation of your investment thesis.
People Also Ask
What is Time-of-Use (TOU) battery arbitrage?
TOU battery arbitrage is the practice of charging a home battery during cheap off-peak electricity hours (such as overnight or during midday solar generation) and discharging that stored power during expensive peak-demand evening hours to reduce high electric bills.
How much energy is lost when charging and discharging a home battery?
On average, residential lithium batteries experience an AC-to-AC Round-Trip Efficiency (RTE) loss of 14% to 18%. This means for every 10 kWh of power pulled from the grid or solar array, only about 8.2 to 8.6 kWh can actually be delivered to your household loads.
Does daily battery arbitrage shorten the lifespan of a home battery?
Yes. Every full charge and discharge cycle contributes to gradual electrochemical cell degradation. High-quality Lithium Iron Phosphate (LFP) batteries are rated for 6,000 to 10,000 cycles (15+ years of daily cycling), but the amortized degradation cost is roughly $0.12 to $0.16 per cycled kWh.
How wide must an electric rate spread be for battery arbitrage to make money?
To generate meaningful profit after factoring in round-trip efficiency losses and battery wear, the difference between your utility’s peak and off-peak rates must be at least $0.24 to $0.28 per kWh. Spreads under $0.15/kWh rarely cover the cost of cycling the battery.